The dashboard presents charts and tables about 1) ecological status or potential ecological status; 2) chemical status 3) quality elements status; 4) list of river basin specific pollutants and 5) list of priority substances related to the EU transitional, coastal and territorial waters, as reported by Member States, for the 1st and 2nd cycle of the Water Framework Directive (WFD) - River Basin Management Plan (RBMP).

Expert dashboards on marine features under other policies
There are several policies that are interlinked with the Marine Strategy Framework Directive (Directive 2008/56/EC), either mentioned in the main text of the Directive, or in the Commission Decision (EU) 2017/848. In the present dashboards, assessments on the ecological and chemical status under the Water Framework Directive (WFD), as well as the conservation status of marine species and habitats under the Nature directives, are presented in a dynamic format, to allow the users to explore, use and download the data and figures in different ways.
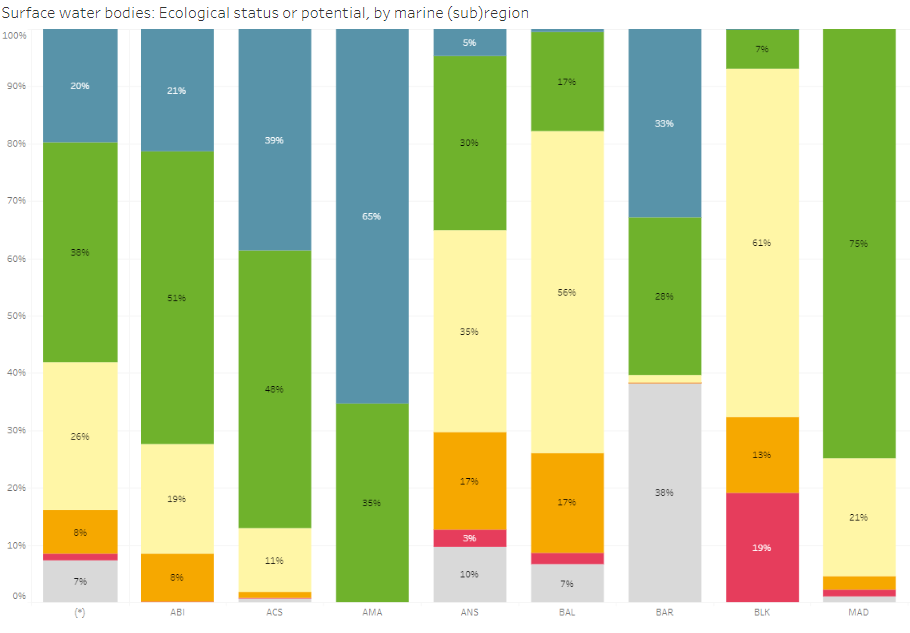
The dashboard shows the ecological status or potential ecological status, by area, of surface water bodies categories: transitional, coastal and territorial waters, as reported by EU Countries during the 1st and 2nd cycle of the Water Framework Directive (WFD) - River Basin Management Plan (RBMP). River Basin Districts (RBDs) were overlaid and mapped with marine subregions.
The dashboard shows the chemical status by area, of surface water bodies categories: transitional, coastal and territorial waters, as reported by EU Countries during the 1st and 2nd cycle of the Water Framework Directive (WFD) - River Basin Management Plan (RBMP). River Basin Districts (RBDs) were overlaid and mapped with marine subregions.
The dashboard shows the River basin specific pollutants in the 2nd River Basin Management Plans of the surface water bodies categories: transitional, coastal and territorial waters, as reported by Member States during the 2nd cycle of the Water Framework Directive (WFD) - River Basin Management Plan (RBMP).
 mpas-dashboards.jpeg
 Ecological status.PNG
The dashboard makes available a number of figures showing the status, trends and distribution of the (non-bird) species and habitats reported for the period 2007-2012 and population distribution, trends and size of birds for the period 2008-2012 and for the period 2013-2018.